Summary
Looking through Design Build Fly’s archives, I learned that pre-COVID reports included analysis on automated eCalc tools. No one on the Propulsion subteam had seen or used this code before, and the knowledge behind it had quietly disappeared. So, I started digging through the old report to understand how earlier members approached the problem, and eventually began designing a new script from scratch that could run automated eCalc simulations. The overall goal was to quickly iterate through propeller, motor, and battery combinations to identify the most promising propulsion setups under given constraints.
Code Structure
The original eCalc automation script was written in Java by a Kyle Waddell in 2017, but by the time I revisited it, the codebase was outdated and incomplete. His program followed a different strategy — it optimized batteries for a selected motor — while my approach began with a fixed battery and optimized everything else around it. Due to the missing dependencies and incompatibility with current Java versions, I decided to rewrite the entire system in Python.
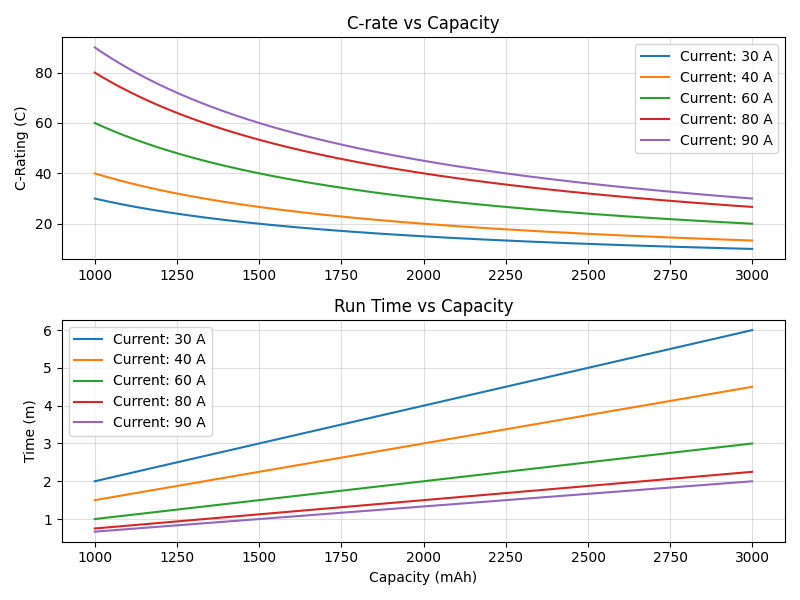
The new version uses three core packages: Selenium, Pandas, and Matplotlib. Selenium handles the browser automation, pretending to be a user filling out the eCalc form. Pandas manages the internal dataframes used to store and filter all the test outputs. Matplotlib is used for plotting — which made it easy to visually compare tradeoffs like static thrust vs. flight time. One advantage of this structure is that it can be adapted quickly for different optimization targets just by adjusting the input sweep.
Motor-Propeller Identification
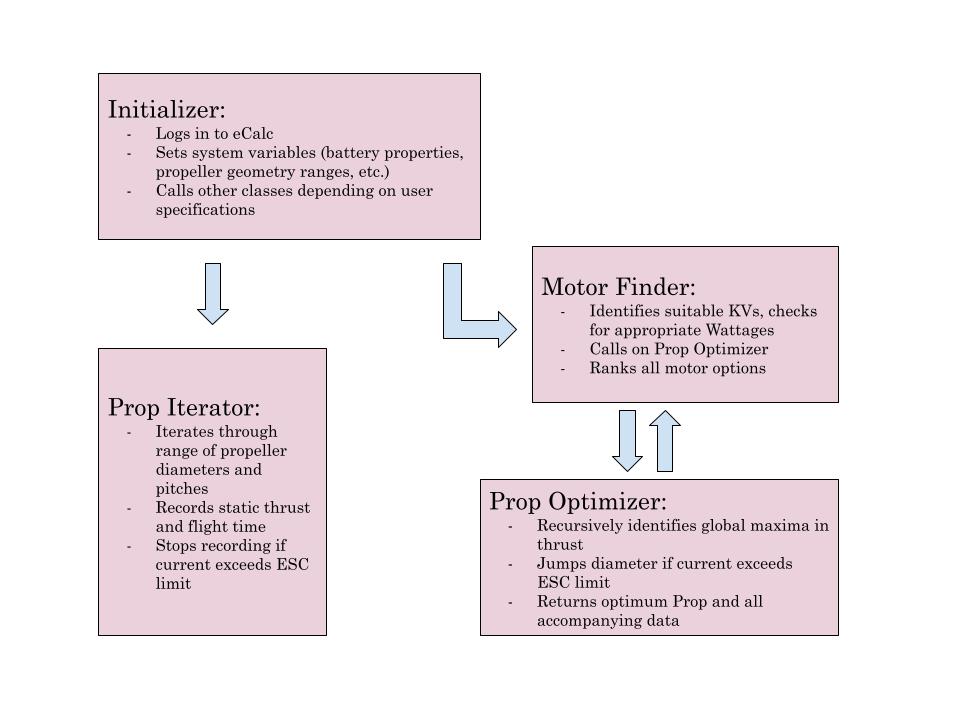
Most of my use of the program so far has been focused on motor and propeller sizing. For a fixed battery, the script loops through a list of motors and tries identify the propeller with the most static thrust for each. I did this by implementing a makeshift gradient-descent style recursive function, which would keep increasing pitch and diameter until a global maximum was identified. Once all results are collected, they’re ranked and saved as a CSV file for further analysis. This made it easy to filter out poor-performing systems early on, while also giving me more insight into how prop diameter and pitch interact with a given motor.
The automation was key to making this kind of large-scale parametric sweep realistic — especially since manually inputting each configuration into eCalc would have taken hours. Once all datapoints were collected and organized, me and my teammates could manually analyze the best motors for the plane. At this point, we could take into account other factors, such as price, shipping time, etc.
Battery Parameter Relationships
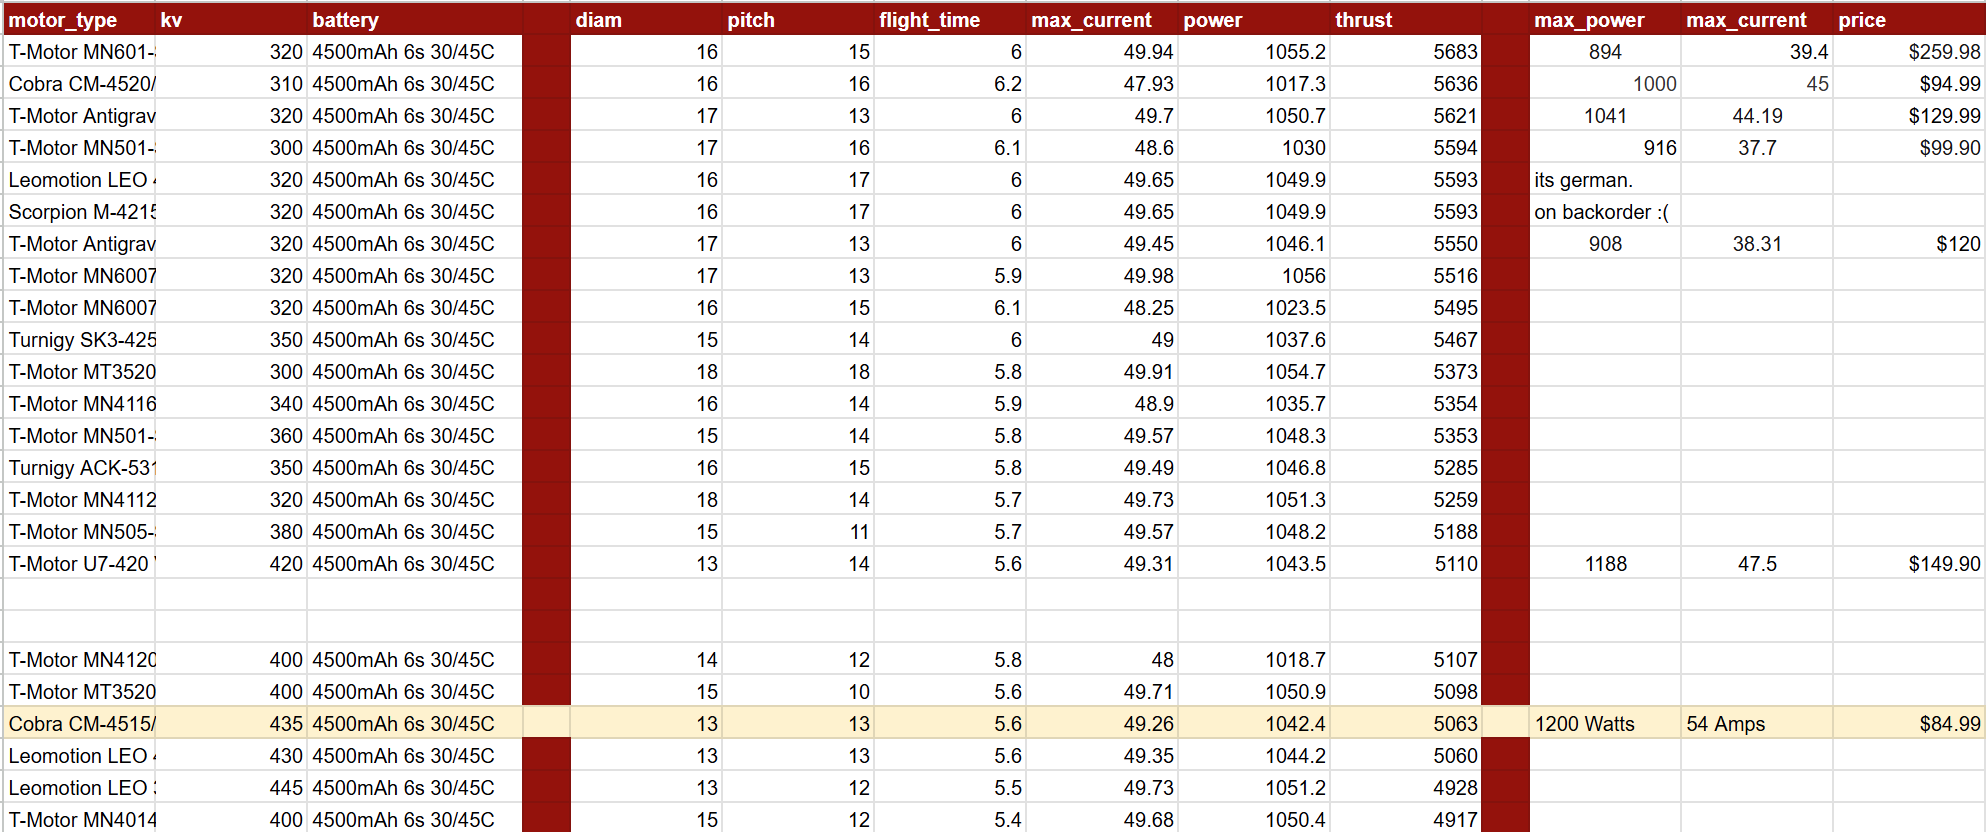
Beyond propulsion iteration, I also used the tool to investigate the effect of battery capacity and C-rating. These directly influence max current draw, which affects both thrust and flight duration. By adjusting the input battery properties, I could visualize how flight time changed with energy capacity, or how motors behaved when current limits shifted. For example, higher-capacity batteries improved endurance and raised max current draw, while higher C-ratings allowed for brief bursts of peak power.
These visualizations also became a powerful tool for teaching newer members during onboarding. Most incoming freshmen struggle to understand the sizing process, and why certain batteries are chosen over others. Having the data laid out in graphs made these relationships a lot clearer, especially when comparing flight times across batteries of similar sizes but different ratings.
Propeller Iteration
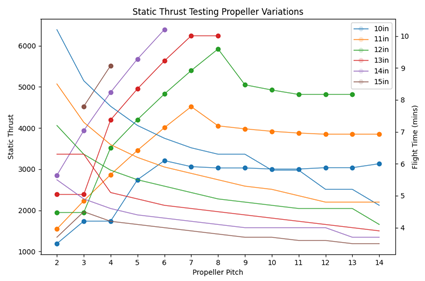
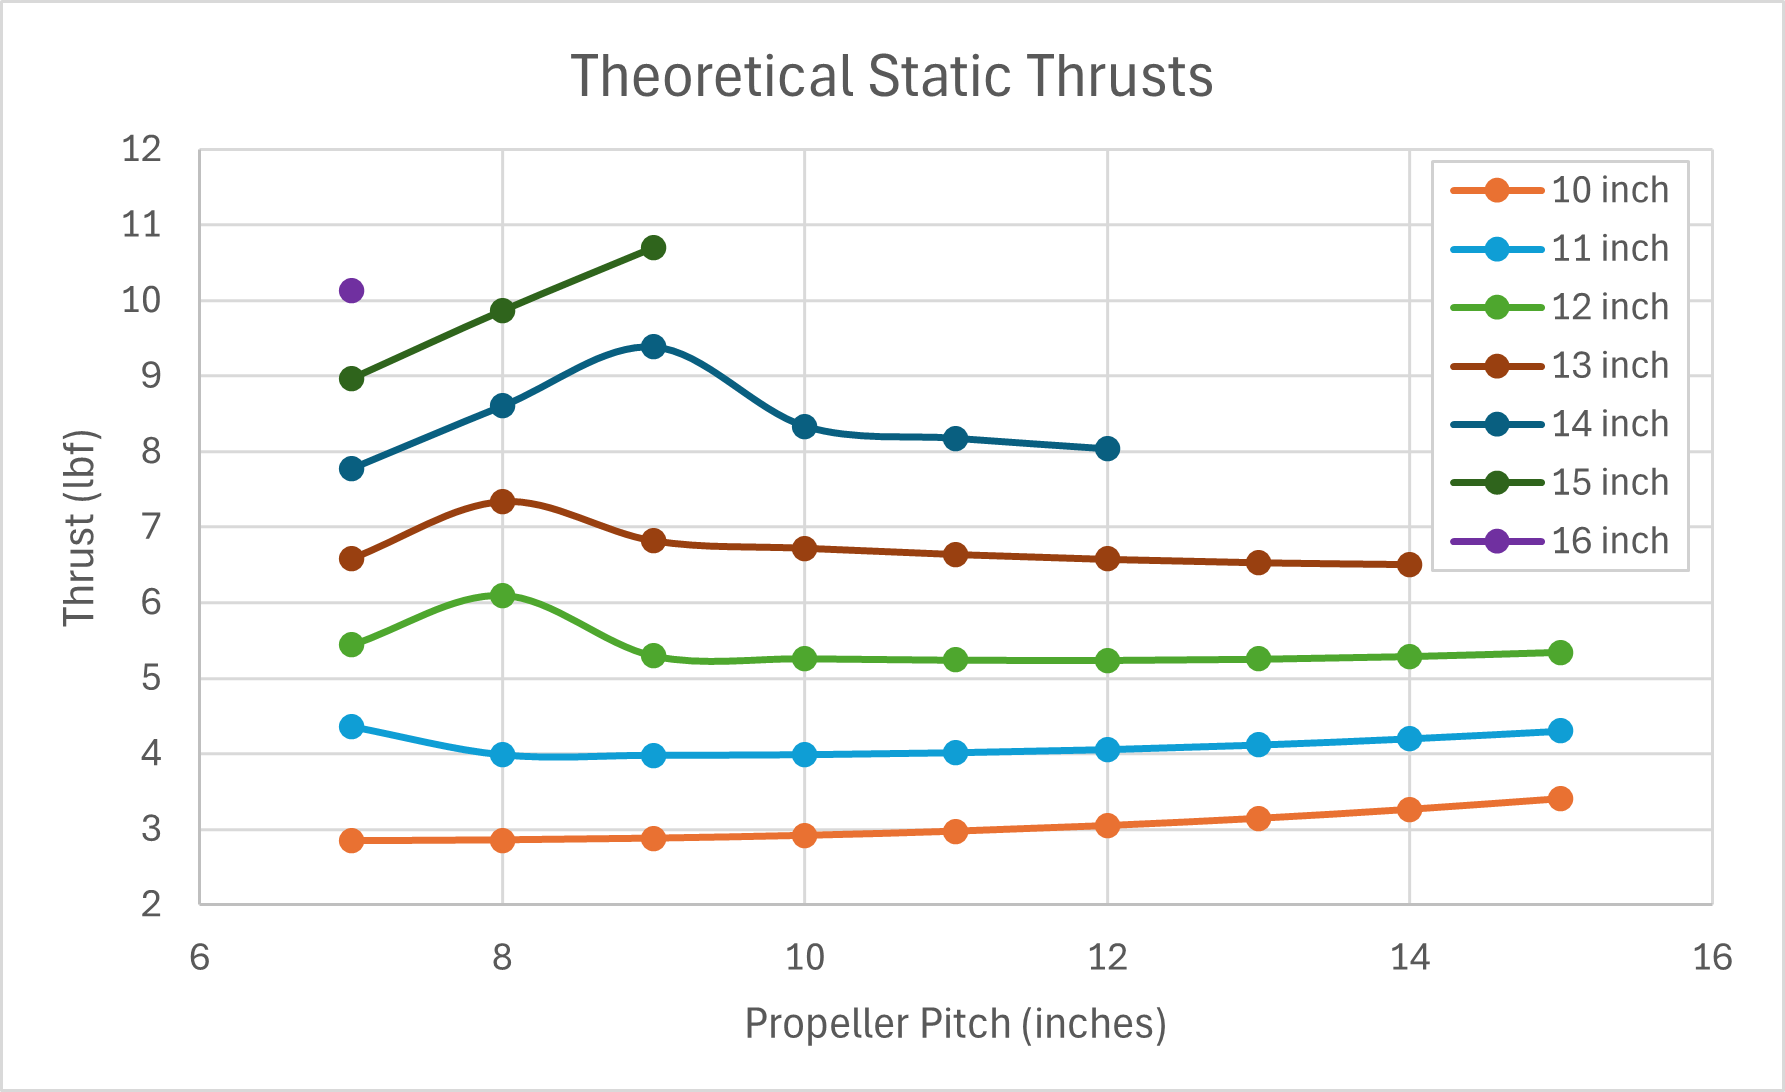
At one stage, I shifted the focus of the eCalc Automator entirely toward propeller analysis. Rather than sweeping through multiple motors and batteries, I fixed those two components and ran a targeted iteration over a wide range of propeller diameters and pitches. For each propeller configuration, I recorded two key outputs: static thrust (or stall-limited thrust if applicable), and estimated flight time.
Because the motor and battery were held constant, the program ran significantly faster — it didn’t have to reconfigure the entire eCalc setup with each loop. This let me generate high-resolution datasets in just a few minutes, making it much easier to visualize the tradeoffs between thrust and endurance.
This approach was especially useful when comparing propellers for specific mission profiles. For instance, if a flight required sustained high thrust (such as carrying a payload during climb-out), I could prioritize configurations with greater thrust output — even if that meant sacrificing some endurance. Conversely, if the mission emphasized long-duration cruising, I could shift focus toward higher flight times, accepting a lower static thrust.
Plotting the results gave us clear visual relationships — thrust vs. flight time curves — which helped identify a “sweet spot” propeller that offered the best compromise for the mission. These results also informed our static thrust testing strategy, giving us concrete benchmarks to compare against measured data on the rig.
Drawbacks
One limitation is the program’s dependence on the live eCalc website — it uses Selenium to control a browser window, so any structural changes to the site could break the automation. It’s also worth noting that eCalc itself is a static tool, meaning it doesn’t simulate in-flight dynamics or account for things like airspeed variation or advance ratio directly. The user has no access to the calculations being run. That said, it still provides fast, somewhat reliable estimates of static performance across a wide range of setups.
Lastly, the script currently runs sequentially and can be slow when evaluating hundreds of configurations. Even so, it’s been a valuable tool — both for narrowing down feasible setups and for developing a more intuitive understanding of how different propulsion elements interact.